

View pipeline runs
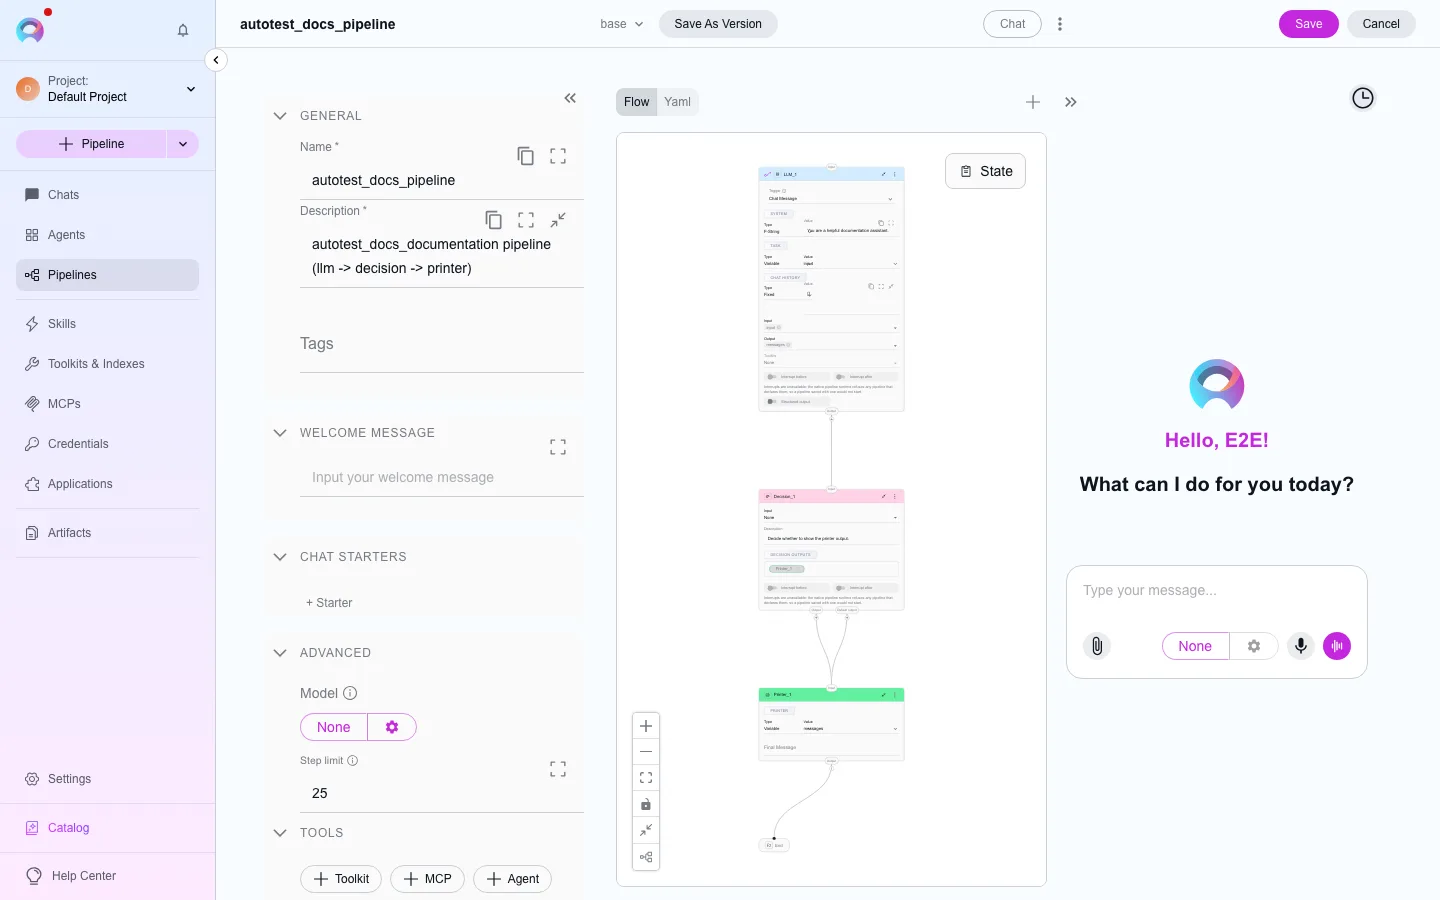
When you run a pipeline, the flow editor shows progress directly on the canvas: nodes the run has reached pick up a status, and a run-state indicator lets you open a step-by-step view of what happened.
Start a run
Run the pipeline (from its Configuration tab, or by using it in a conversation).
Watch node status
As execution proceeds, nodes on the canvas update to show whether they’re pending, running, done, or failed.
Open the run timeline
Click the run-state indicator to open a dialog with a stepper across every step the run has taken so far. Select a step to see the pipeline’s state before and after it ran.
Stop or delete a run
From the same dialog, you can stop a run in progress.
Run history
Section titled “Run history”The clock icon next to the run-state indicator opens History: every past conversation that used this pipeline, newest first, with its date, a derived duration, and its message count. Select a run to see its recorded trace — the tool calls and thinking steps the runtime logged for that conversation. A pipeline with no past conversations shows an empty state rather than a blank panel.
Reading a step’s state
Section titled “Reading a step’s state”Each step in the timeline shows the pipeline’s state as it was immediately before and immediately after that node ran. This is the most direct way to see what a Decision or Router node actually branched on, or what an LLM node’s raw output was before a later node reshaped it — useful for working out why a pipeline took the path it did, or why it stopped where it did.
A step that fails is marked with its own error status in the timeline, alongside the state at that point — checking the state there is usually the fastest way to tell whether the problem was bad input, a missing credential, or a node reading a state key that was never set.