

Analytics and usage
Analytics and Usage give you two views of the same underlying activity: Analytics is about understanding how the project is used; Usage is about tracking spend against a budget.
Analytics
Section titled “Analytics”Settings › Analytics is available to any project member and requires the analytics_enabled admin flag. Data is scoped to the currently selected project and refreshed from the API, cached for a few minutes.
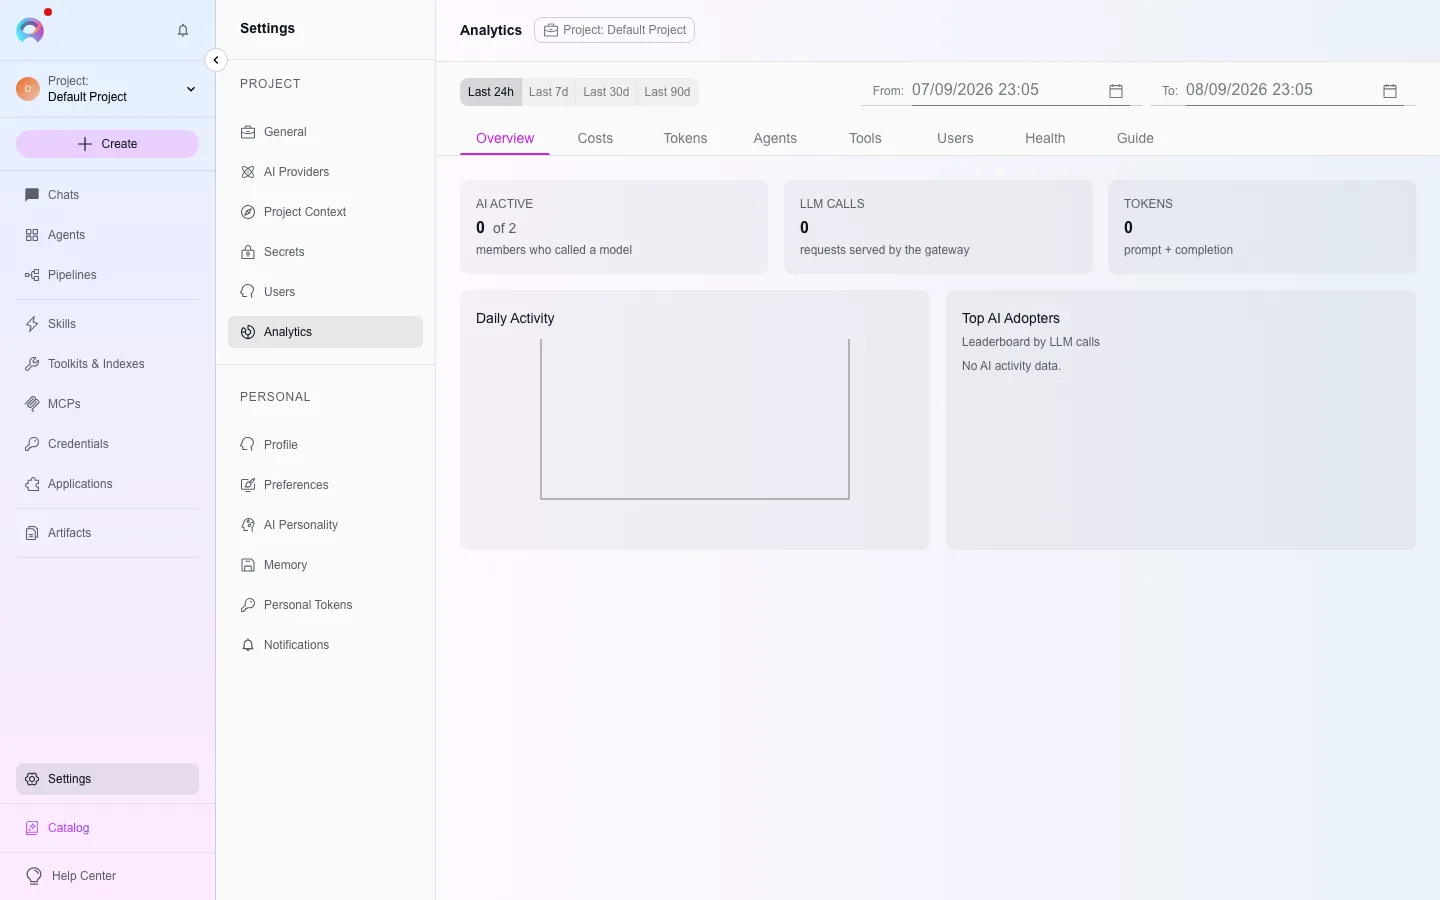
Choose a date range with the quick presets (Today/Last 7d/Last 30d/Last 90d) or custom From/To pickers, then switch between the tabs below. Each preset covers whole calendar days, from 00:00 on its first day to 23:59 today, and the To minute is included; for the last 24 hours or another exact window, set From and To by hand. From cannot be later than To. Daily charts group activity by UTC day, so outside UTC one local day can appear as two chart columns. The COST tile is billed spend per billing period (a calendar month), so it names the period it covers; under Today it is the month to date.
Overview
Costs
Tokens
Agents & Pipelines
Tools
Users
Health
Select Export to Excel to download all tabs for the selected range as a single workbook.
Settings › Usage requires the cost_budgets_enabled admin flag and shows spend against the current monthly billing period for platform-shared models only — models configured with your own provider credentials are billed by that provider and are not included.
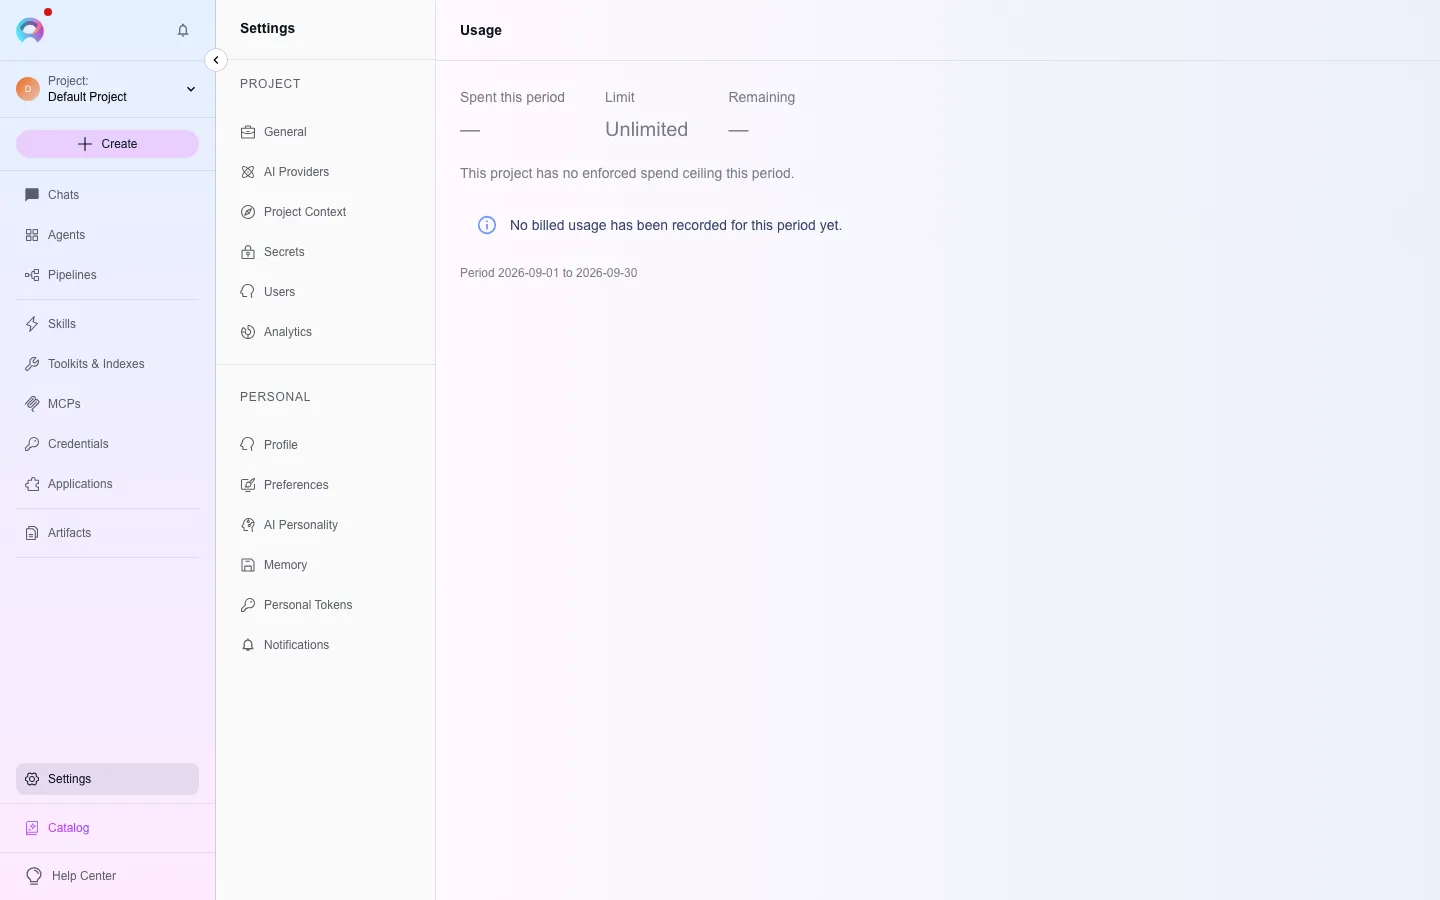
The page shows, for the current billing period:
- Spent this period, Limit (or Unlimited) and Remaining.
- A usage meter with the percentage of the limit used. It changes colour past the project’s warning threshold and again at the limit; a scope with no enforced limit says so instead of showing a meter.
- The billing period’s start and end dates.
A member who is not a project administrator sees the percentage and the period but not the amounts. When a request is refused because your own member budget is exhausted, the error links to this page scoped to you, showing your own spend against your own limit in this project.
A warning banner appears as usage approaches its limit; once the limit is reached, requests to platform-shared models are refused until the limit increases or the period resets. Select Refresh data (the circular-arrow button in the header) to fetch the latest figures without reloading the page; if a refresh fails, the last loaded figures stay on screen with a note that they could not be updated.
Troubleshooting
Section titled “Troubleshooting”Analytics or Usage section is missing
analytics_enabled or cost_budgets_enabled) is off for this deployment — ask your administrator.