

Audit trail
Audit Trail is a read-only view over what happened on the deployment — there is nothing to edit or configure here. Use it to answer “who did this, and when,” whether you are investigating an incident, confirming a change actually landed, or checking whether a scheduled job ran.
Review activity
Section titled “Review activity”Choose User or System events
User events are actions a person took; System events are platform-generated (for example a scheduled job firing). Each has its own tab.
Filter
Narrow by date range (with quick presets like 30 minutes, today, yesterday, 7 days, or 30 days, plus an explicit From/To), event type, project, user, or errors-only.
Use the heatmap
A calendar-style heatmap shows activity density over time, so a spike is visible before you drill into individual events.
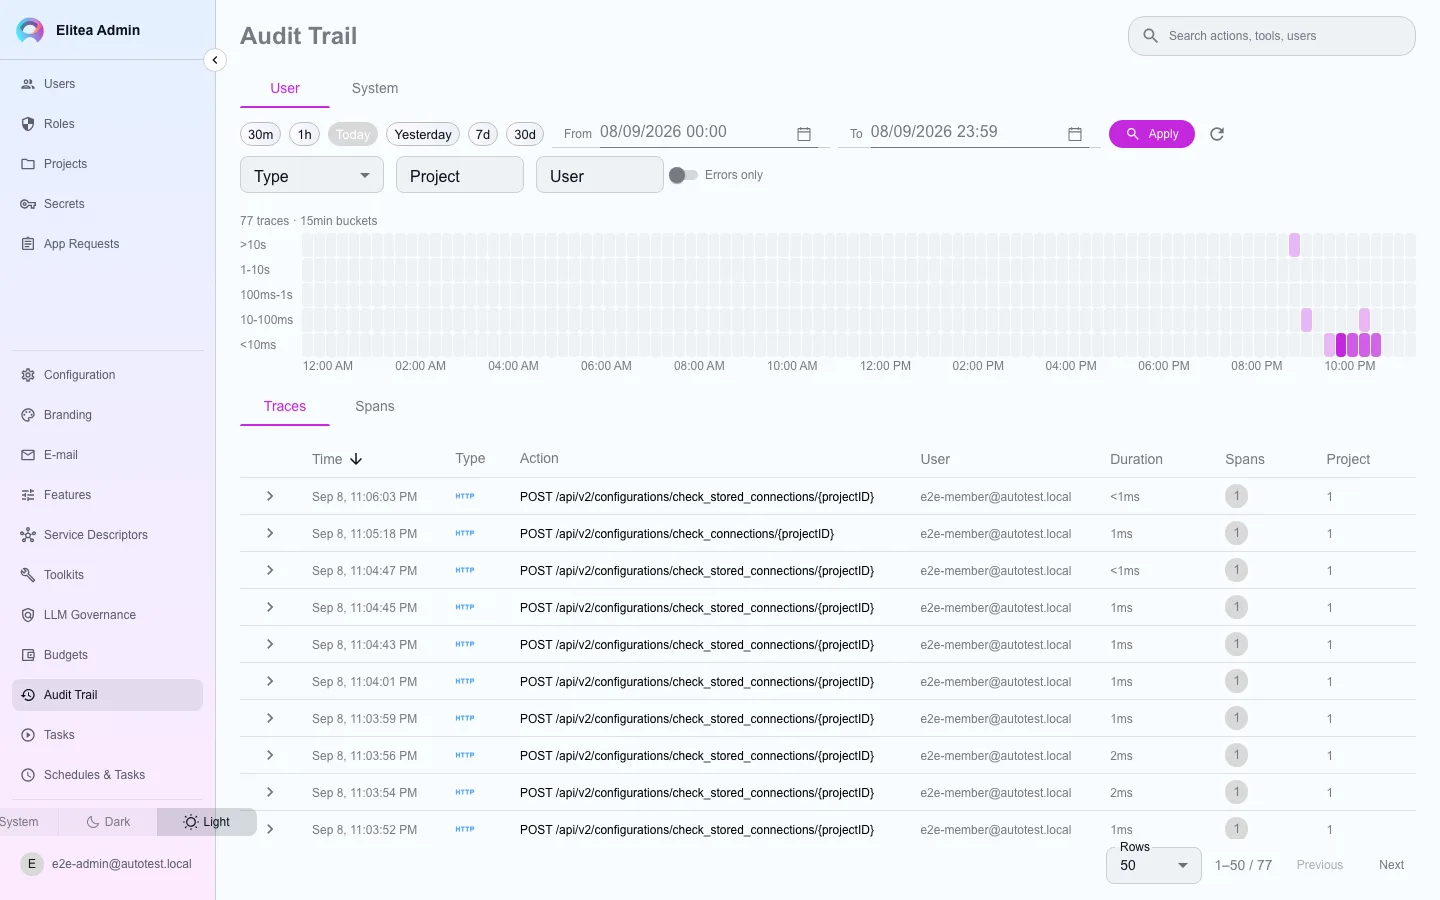
Traces and spans
Section titled “Traces and spans”A second view mode, alongside events, shows execution traces and their individual spans — each row names the action and, when there is one, the tool or model that ran it. Spans can be filtered by duration band (under 10 ms, up to over 10 seconds), which is the fastest way to find what is running slowly across the deployment rather than one conversation at a time.
Investigate one person
Section titled “Investigate one person”From the Users page’s row menu, the activity drawer filters this same audit data to one account — useful when investigating a specific person’s actions rather than browsing the whole trail. See Users and roles.
Export to your SIEM
Section titled “Export to your SIEM”Audit Trail is the place to look; it is not where evidence should be kept. The hash chain on security audit events makes tampering detectable, but immutability and long retention belong to your SIEM or WORM store. Elitea sends two streams there, in one versioned envelope, elitea.audit.v1:
- Security audit events from the security audit outbox (credential decisions, grant, binding, mandate and delegation changes). These exist when enterprise credential governance is on. Approval events (
ai.elitea.security.v1.agent.approval) are written for every run, with or without governance: one event for each pause, decision, timeout and unattended outcome of a sensitive tool or review node. Each stop by the agent circuit breaker writes oneai.elitea.security.v1.agent.breakerevent (actionagent.breaker.tripped) with the rule, the observed value and the limit. Each change of the platform preamble writes oneai.elitea.security.v1.config.changedevent (actionconfig.platform_preamble.revised) with the revision and the SHA-256 of the text. Each OIDC relink writes oneai.elitea.security.v1.identity.link.changedevent (actionidentity.oidc_link.replaced,.clearedor.added) with the user and the operator. It holds no subject and no hash of one. Each event carries its position in the tamper-evident chain. - The audit trail on this page (
centry.audit_events): one event per completed request, scheduled job or admin task.
Two transports are built in, and you can use either or both:
| Transport | Use it when | Set |
|---|---|---|
| OTLP logs | Your collector or SIEM speaks OpenTelemetry | ELITEA_AUDIT_EXPORT_OTLP_ENDPOINT |
| Signed webhook | You run your own receiver, or a SIEM with an HTTP intake | ELITEA_AUDIT_EXPORT_WEBHOOK_URL and ELITEA_AUDIT_EXPORT_WEBHOOK_KEYS_FILE |
With neither set, export is off, no relay starts and nothing dials out. The full list of settings is in Post-install configuration, and the field-by-field schema, a sample event, signature verification and a collector configuration are in the audit event schema reference.
What the export guarantees
Section titled “What the export guarantees”- At least once. A row is marked exported, or a receiver’s position in the audit trail advances, only after that receiver accepted it. If your receiver is down, nothing is lost: events wait and are sent in order when it returns. Deduplicate on
event_id. - No row is skipped. The audit trail is read in commit order: a row is exported only once every transaction that could still add an earlier row has finished. A long-running database write transaction therefore delays export (the lag alert shows it) rather than letting a late row slip past.
- Each receiver has its own position. With both transports on, a receiver that is down does not make the healthy one receive the same events again; when it returns it resumes from where it stopped.
- Asynchronous. Export runs in background relays. It never slows or fails the request or run that produced the event, and it holds no database transaction open while it calls your receiver.
- Outages do not drop evidence. When the webhook receiver refuses a batch as malformed or too large (HTTP 400, 413 or 422), Elitea splits it in halves and sends each again, down to single events, so the other events in the batch are delivered. Only a single event the receiver refuses on its own, on five passes, is dead-lettered, by itself. A receiver that is down, rate limiting, or rejecting your credentials (401, 403, 404, 429, 5xx) is never dead-lettered; the lag alert fires instead. A security audit record that cannot be decoded is dead-lettered alone (sink
decode) and the rest of its batch is sent. A dead-lettered event is still in its source table and is also listed inelitea_runtime.audit_export_dead_letters. - Retention never outruns the export. While audit export is on, the audit trail retention sweep in elitea-scheduler does not delete a row that has not yet reached every receiver, however old it is. If you switch the export off, delete its positions (
DELETE FROM elitea_runtime.audit_export_cursors WHERE stream = 'admin_audit') so retention resumes; the scheduler logs a warning while it is holding rows back for a position that has not moved within the retention window. - Egress is guarded. A webhook receiver on a private or loopback address is refused unless
ELITEA_AUDIT_EXPORT_EGRESS_ALLOWLISTnames it. Redirects are never followed.
Approval events
Section titled “Approval events”Each approval event names the actor (principal_ref, user:<id> or system:elitea-main), the outcome (data.action, for example agent.approval.approved or agent.approval.unattended_failed), the tool (tool_name), the toolkit (toolkit_name) and the SHA-256 digest of the tool arguments (arguments_digest). The arguments are never in the event. invocation_id is the interrupt id, and decision_id is the row of elitea_runtime.approval_ledger. See Approval evidence and unattended runs.
What it does not do
Section titled “What it does not do”- It does not make the stored events immutable, and it does not retain them for you. Keeping them is your SIEM’s job; the shared-responsibility split is in the enterprise controls section.
- Existing audit trail history is not replayed by default. Export starts at the newest row when you turn it on; a row still being written at that exact moment may count as history. Set
ELITEA_AUDIT_EXPORT_AUDIT_EVENTS_FROMtobeginningbefore the first start to send the whole table. - Audit trail rows are not chained yet, so the
chainobject is present only on security audit events.
Watch it
Section titled “Watch it”elitea-main serves Prometheus metrics for the export on port 9464 (ELITEA_AUDIT_EXPORT_METRICS_ADDR): elitea_audit_export_lag_seconds, elitea_audit_export_backlog, and the delivered, failed and dead_lettered counters. The chart ships a PodMonitor and three alerts, EliteaAuditExportLag, EliteaAuditExportBacklog and EliteaAuditExportDeadLettered, wherever the Prometheus Operator API is served. The same port serves the runtime safety metrics and has their alerts (see Agent circuit breaker).